It ain’t Kanban if you don’t use WIP Limits

26 April, 2017 (20:07) | Uncategorized | By: seth

In my last post I discussed How WIP Limits work to help you get more stuff done.

Some folks like to compare Kanban and Scrum, but this is not really an apples to apples comparison. Scrum is a framework with defined roles, activities and artifacts – It gives you a prescriptive formula for how to run a Scrum Team. Kanban on the other hand is a set of Principles and Practices that you apply to whatever process you have (even Scrum) to improve it. These Principles and Practices get somewhat different wording depending on your source, but here are the ones I tend to reference:

Kanban Principles: Keep these in mind whenever making decisions about your process

  • Start with what you do now
  • Agree to pursue incremental, evolutionary change
  • Initially, respect existing roles, responsibilities & job titles
  • Every team member is a leader

Kanban Practices: Apply these to you processes

  • Visualization
  • Make Policies Explicit
  • Limit WIP (Work in Process)
  • Manage Flow
  • Implement Feedback Loops
  • Improve Continuously and Collaboratively

So while Scrum is rather prescriptive, Kanban is general non-prescriptive. There are many approaches you can take that are consistent with the Principles. And there are many ways you can apply most of the practices…. well except for one, you either limit WIP or you don’t. But that alone should not convince of the veracity of this blog post’s title. To do that let me take you to Kanban’s roots… in the factory.

The Kanban process started with the Toyota Production System for manufacturing cars in Japan. The term Kanban in Japanese is as follows

看板

..and it means “card” or “sign”. What we call Kanban is actually the Kanban process — a process that uses these Kanban or cards. Here is what a Kanban card in a physical factory might look like (ref)

It specifies a part to be produced and a quantity which to product.

Let’s see how this process works in the factory. In the below diagram (ref) the Green A is the Kanban card. This is one machine in an assembly line, there is another machine downstream (to the right) consuming the widgets made by the machine below.

The Kanban card limits the total number of widgets. The completed widgets sitting there waiting to be consumed by the next machine plus the widgets in process of being manufactured cannot exceed the quantity on the Kanban card. There can be multiple Kanban cards used in which case it can never exceed the total quantity on all the Kanban cards — this is the Work in Process (WIP) limit. Without the Kanban card (and associated WIP limits) this machine would just run and produce widgets even if the next machine cannot keep up. In that case they would just pile up on the floor in front of the machine building up inventory which takes up resources and delivers no value (value is only delivered at the end of the assembly line after all machines have processed the widgets). The Kanban card optimizes flow through the system, and creates a pull system by which this machine only created widgets when the downstream machine requests (or pulls) them.

So now let’s come back to software. Here is what a Kanban board may look like for a software project. The numbers in brackets represent the WIP (Work in Process) limits

Since we know Kanban (看板) means “card”, I will ask, where on this board are the Kanban cards? Are the sticky notes the Kanban cards?

The sticky notes correspond to the work being done. They are the “parts” in the factory being produced. The columns on our Kanban board are the “machines” in the factory. Remember, the Kanban card limits WIP of any given machine.

The WIP limit is the Kanban card


If we wanted to, instead of writing “[2]” we could put two markers in our Implement column and state we can never have stickies (work items) in that column without a marker. These markers would be Kanban cards, limiting the work in process (WIP) in the Implement column.

It just easier to write the WIP limit as a number than to create all the Kanban cards.

So, without WIP limits you are not using Kanban cards. And if you are not using Kanban cards then you are not doing Kanban.

You might have lovely continuous flow process. It might have a glorious board, and your team might methodically update it and move their stickies from start to completion. This might work for you and I would not tell you that you need to change it. But It ain’t Kanban if you don’t use WIP Limits.

How WIP Limits work to help you get more stuff done

20 July, 2016 (11:12) | Uncategorized | By: seth

An UPDATED version of this blog post is here: https://bit.ly/wip_limits

Two key practices in Kanban are

  • Limit WIP
  • Manage Flow


(image from Lean Kanban, St Louis)

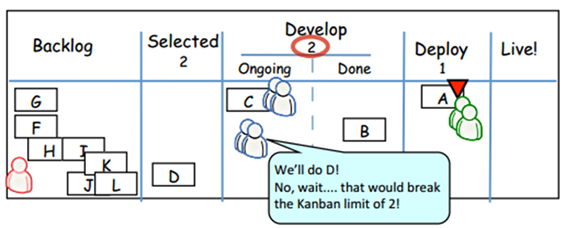
“Limit WIP” means limit the work in process — for any given step in your workflow you limit how many items can be in that state. So a WIP Limit of 2 on your “Develop” step means once 2 items are at that step, the team cannot start to develop any more items until at least one of the current items moves to the next step.


This diagram comes from One day in Kanban land by the always awesome Henrik Kniberg – you should bookmark it and check it out: http://blog.crisp.se/2009/06/26/henrikkniberg/1246053060000

Recently a developer on one of my teams which is using Kanban complained to me that the WIP limit seemed artificial, and that when he was ready to start new work it seemed silly to restrict him from doing so. That got me thinking about how to explain why do we limit WIP and how does limiting WIP help the team to get more stuff done. In this blog I will explain how

  1. Limiting WIP improves flow, and helps us produce more quickly and reliably
  2. Limiting WIP drives collaboration, and gets the team working together
  3. Limiting WIP aids our commitment to completing valuable features

Limiting WIP improves flow

You have a workflow where items come in, are developed, tested, deployed, and other steps towards Done (or “Live” as above). You want your workflow to… well…. flow. That is items come in, do not spend too much time in any given workflow step, and continuously and quickly emerge out the other end into the Done state.

Kanban Aside:

  • Items continuously reaching done is measured by “throughput”, the number of items done per time.
  • Items quickly reaching done is measured by “cycle time”, the amount of time it takes from starting an item coming into the workflow, until it reaches done.

Here is an example of a workflow without WIP limits


The team is busily working on Development (say coding) of many items. Everyone is busy and working hard. But look at the flow. Are items getting done continuously or are they just accumulating under Develop? Are items getting done quickly, or do they linger in the Develop state? It reminds me of something like this


What then if we applied a WIP limit to the Develop state? It might look like this


You can imagine that the WIP limit of 4 on the Develop state “squeezed” all the work downstream to more evenly distribute it along the work states and drive more of it to done. This “squeeze” visualization is OK as a thought exercise, but in reality what has occurred is one of the following:

  1. Developers unable to take on new work into the already full Develop column either collaborated with other developers working on items already being Develop (see the next section)
  2. Or they moved their focus downstream to work on code review or validation. In this latter case this moves those items downstream creating “open slots” in Code Review and Validate.

Number 1 does not necessarily help in this case as there is nowhere for an item to move to once Develop is complete, since Code Review is also full. So developers instead focus on action number 2 and move items downstream towards the Done state. This creates space for items to move on from Develop and therefore creates space for items to move from Backlog to Develop. This is the “pull model” of Kanban in action. So perhaps non-intuitively, it is applying WIP limits that opens up that valve in the bulging water line picture above, focusing work downstream rather than continuously stuffing it into “the bulge”.

Kanban Aside:

  • There are also other actions besides 1 and 2 identified. Another one is called “slack” where developers take on tasks outside of the main workflow to improve things such as efficiency, operations, or addressing technical debt. Developers might even just read a book or take training, this is called “sharpening the saw”. Slack in excess is a sign of a problem, but a little slack is a good thing.

Limiting WIP drives collaboration

As mentioned earlier, then a developer cannot pull in a new item into Develop due to a WIP limit, one way she can continue to be productive is by collaborating with other developers on an item already being Developed. Or perhaps she looks downstream and sees QA needs help, she can pitch in there and help the QA Engineer out (perhaps helping to build out some automation). The power of collaboration is getting multiple talents and multiple perspectives so that we arrive at the best outcome (pair programming also leverages this advantage of collaboration). But another advantage of collaboration is that stuff gets done faster, and getting stuff done faster was one of our goals (and a sign of good flow).

To illustrate how collaboration (driven by lower WIP limits) gets things done faster see the following workflows. One has a WIP limit of 1 and one has a WIP limit of 2. Assume for simplicity that each item takes two developer-days to complete (and that all developer are equivalent). Note that the overall amount of work done (Throughput) is the same — one item per day. But look at an individual item like Item 2. With a WIP Limit of 2 it takes two days of work to complete (this is the Cycle Time). But with developers collaborating under a WIP limit of 1, it only takes 1 day to complete. Completing items faster is preferred because

  • The code doesn’t rot as team members check in new code
  • The developer doesn’t lose the context he or she gained in writing the original code
  • And we get feedback on the item faster, speeding up our ability to inspect and adapt


Kanban Aside:

  • There is mathematical rigor behind the assertion that lower WIP (driving collaboration) gets stuff done faster (reduces cycle time). It is called Little’s Law and can be stated as


Limiting WIP aids our commitment to completing valuable features

In Scrum we plan a sprint, and as a team commit to completing the stories in that sprint, thereby delivering value with every sprint completion. In Kanban we usually do not have sprints, instead using a continuous flow model. WIP limits are how we provide this same level of commitment that Scrum provides.

In Scrum we plan a sprint based on past velocity, and then as a team commit that we will complete the selected stories for that sprint by sprint end. This commitment is an important part of Scrum, however I have observed that it is a very common problem among teams world-wide that they fail to complete all the planned stories for a given sprint. “Punting” unfinished stories from one sprint to the next is supposed to be a practice to be avoided, however it is in actuality common among even the best intentioned scrum teams.

In Kanban, we often have a continuous flow model and not a sprint one, so the Scrum method of committing to a set of sprint stories will not work. We take a different approach to team commitment. By limiting WIP we commit to ensure that the most important things (the things the top of the backlog) get the teams’ attention, and that often multiple members of the team will collaborate to deliver those items.

So in Scrum we might recognize half-way through the sprint that stories will not be finished, and then swarm on a select few stories in order to finish those and meet at least part of our commitment. In Kanban we limit WIP and we ALWAYS swarm to ensure we Stop Starting and Start Finishing.


Using story Points for estimation – the big view

13 May, 2016 (13:56) | Uncategorized | By: seth

Most agile software teams choose to define User Stories as the increment of value they deliver, with a given release or product comprising multiple of these stories. To figure out what they can do and when, teams need to estimate these stories. Estimating, using time units such as days, person-days, or ideal-days is a big mistake. You should instead use unit-less story points. Here is why.


Unit-less story points are better than estimating in time units

Relative estimation is easier than absolute estimation

If I were to ask you how tall is the Empire State Building in NYC, could you tell me in feet or meters? By asking for a measurement with an actual length unit, I am asking for an absolute estimate. (similarly asking for time in days is also an absolute estimate) But what if I showed you the diagram below and asked you how tall it is relative to the ‘Great Pyramid”? You could answer that it is about three times as tall as the pyramid. Similarly you can say the Eiffel Tower is about twice as tall as the Great Pyramid. These are relative estimations, and we tend to be a lot better at making these than we are at absolute estimations.


The way this works with stories is you pick several small-ish stories you have already completed, and you assign them one or two story points, where the two-point stories are about twice as big as the one-point ones. Now you have a baseline with which to measure stories you have not yet started. Going-forward, pick a new story to be estimated and if it is twice as big as a one-pointer, assign it two story points. If it is twice as big as a two-pointer, assign it four story points. Keep in mind for every team, story size will mean different things depending on what baseline they chose.


Time depends on who is doing the work

 Another reason not to use time base estimation is that a veteran developer who has been on the team for years will likely be able to complete a story in a fraction of the time it would take the new intern. So calling a story a 3 day story is meaningless — is it 3 days for the pro or 3 days for the intern? Instead we should measure story size using story points.


How it works in real life

What do we mean by “size”?

We are measuring story “size” but what does that mean? It is not time, otherwise we would just be referring to time by another name. Size is a measure of scope and complexity, and therefore ultimately effort. Yes this will correlate to time, but as we previously discussed time will vary depending on who is doing the work. With size we are attempting to capture a measure independent of who does the work.


But we need to ultimately know time

We do ultimately need to know what will be ready for release and when it will be ready. Our stakeholders are often keenly interested in release and availability dates. This information can be calculated from your story points. Just look at what your team has historically delivered — add up the story points for all stories completed by the team and calculate how many points the team delivers over time. This is called velocity (or delivery rate) and tells us what the team is capable of doing. We can then look at all the stories that remain, and add up the points for all those stories. Using the velocity we can then calculate how much time it will take to complete all those stories. In other words:  

Time to completion = Remaining points / Velocity (in points per time)

Of course this is the simplified version. For more details, see this.


Story points can be fun

Many teams choose to make up fun units rather than use generic story points. One team I know uses “aspirins”, since the bigger a story is, the bigger headache it can be. Other teams use “jelly beans” or “gummy bears”.


Some best practices

Estimate as a group

Group exercises like Planning Poker enable you to engage the whole team, bringing the power of collaboration to your estimates. When doing group estimation be sure to use methods where everyone estimates simultaneously. Otherwise the first person to speak will create an anchor bias in subsequent answers from other folks in the group.


Avoid false precision by using an increasing sequence –

When assigning story points you should use a sequence with increasing gaps between consecutive numbers. Many teams use powers of two (1, 2, 4, 8, 16…) or a Fibonacci sequence (1, 2, 3, 5, 8, 13, 21…). The reason for this is that a small story is easier to understand and leaves less room for estimation error. As a story gets bigger your estimate will be less precise. Therefore deciding between 15, 16, or 17 story points is meaningless – in this case you would assign 16 and move on

Ease of estimation is one reason you should favor smaller stories, and when a story estimates as big, you should try to break it into smaller stories. Another reason to favor small stories is that you will finish them quicker. You will be able to show value to your stakeholders more often and get feedback to keep your project on track.


Getting started

The above information is all available elsewhere on the internet, but I could not find a single citation that discusses all the points above together. Now with all this info in one place, you can now get some ideas on how to proceed with your team. As you do, you will need more details and for those you can search and dive-deeper on each issue I mention above.


Thank you to Ed Tellman and Alex Zotos who helped me with this blog.

Why inspect and adapt?

10 November, 2015 (14:46) | Uncategorized | By: seth

In a recent talk I gave on Scrum I highlighted the power of inspect and adapt cycles.  Or as the the Agile Principle puts it:

Our highest priority is to satisfy the customer through early and continuous delivery of valuable software.

First I talked about a non-agile project that did NOT inspect and adapt.   On this project every month (or week, or day) we add some good stuff (valuable features and functionality) and we add some bad stuff (bugs, worthless features, poorly implemented functionality).  Conceptually it looks like this:

image

But when we inspect at the end of every cycle (month, week, day) and adapt based on that inspection then we find what works and double-down on it and find what does not work and eliminate or fix it.  Conceptually then it looks like this:

image

And we would rather release something that looks like the second graph and not the first.  That is the power of inspect and adapt.

Back to the Future Part 2 – Predictions, Hit or Miss

24 October, 2015 (20:57) | Uncategorized | By: seth

In honor of the recent Oct 21, 2105 “Back to the Future Day” I have started to re-watch the trilogy with my daughters.  It is their first time seeing it.  I guess I underestimated how difficult it might be for a 4 year old just starting to master the concepts of yesterday and tomorrow to comprehend multi-timeline time travel, but both she and my 7 year old are have enjoyed parts 1 and 2 so far.

image

I have seen some lists of BttF’s 2015 predictions, but sitting there watching the movie I wrote the following list (roughly in order they appear in the movie), which I believe to be more comprehensive than I have found elsewhere.

Prediction Hit or Miss Notes
Bar Code License Plates Miss
Sleep Inducing Alpha Rhythm Generator Miss
Weather control Miss
Self adjusting jacket Miss
Self tying laces Miss
“Caution Silicone” – label on boxes in alley Miss well… there was a flap over silicone breast implants, but the MSDS shows it to be still be mostly harmless
$50 for a Pepsi Miss
Flying Cars/ Freeways in the sky Miss
Personal inter-continental transportation Miss The sky-way sign shows London as a destination
Personal fusion power Miss
Doc’s opaque metal goggles Miss Could be considered “hit” if you charitably assumed these are augmented reality lenses of some sort
Nostalgia Café for the 80s Hit We had these circa 2000, not sure if they are still around
Fashion Miss (mostly) Rainbow hat (Marty Jr)
Face tats (Biff’s gang)
Two ties (older Marty)
Broad shoulders, metallic material, etc.
USA Today logo Miss
2 hour justice / eliminated all lawyers Miss
Youth treatments (that have no discernable effect) Hit Although I have not heard of doing blood transfusions
Bionic implants (Griff) Miss Not counting surgical joint replacement here
Holographic ads Miss We have something, but nothing like the Jaws ad
Holomax theater Miss No credit for 3-D movies – they had those in the 50s in some form
Hover boards Miss
Automated gas station Miss
05 Second Service Pac Fax” (on US Mail box) Miss I could give credit her for email, but this is something involving a physical mailbox
Pepsi logo Miss
Pepsi bottle Miss Crazy wide-top design
Video games do not use hands Hit The kids in the café scoff that Marty uses his hands to play the video game
Video games with hands are considered “children’s toys” Miss not yet…
Auto-drying clothes Miss
Cashless payment on a tablet (save the clock tower, taxi) Hit
Books on “vinyl paper” Miss They totally missed the advent of eBooks
Drone camera (USA Today reporter drone) Partial Yes to the camera, not to it being used for news reports (apparently autonomously) yet
Autonomous Drone trash cans Miss
Thumbprint to assess ID (biometrics) Hit
Scrolling LED Name Tags on Hats Miss As the police had
Surf Vietnam Partial Not necessarily a “destination”, but there is some chatter on surfing Vietnam on the web
Suspended Animation Kennel Miss
“Tranks lobos, and zipheads” (slang used by the Police) Miss
Home automation “lights on” Hit
Scene screen (using actual window-shade like screen) Miss
Flat screen monitor in house Hit
No doorknob on door – biometrics only Miss not commonly used for home
Food Hydrators / de-hydrated food Miss
100s of channels Hit But we had this by the 90s, so not a bold prediction
Drone for walking dog Miss
Voice commands Hit And they still do not work well: “Fruit PLEASE”
Wearable Tech (Goggles on Marty Jr and Marty’s daughter) Hit
Video 2-way communication Hit
Fax still popular Miss

So that is 11 out of 47, or 23%

Even so, it does not really look like our reality.  It is crazy to think that the 80s are as distant in the past to us, as the 50s were to the folks who first watched BttF in the theaters.

Working at Amazon

31 August, 2015 (09:06) | Uncategorized | By: seth

By now you have certainly heard of the NYT piece (or as I like to refer to it, the NYT hit piece) on working at Amazon.  And if you are truly interested, you may have read:

As a current Amazonian, I have been asked by several folks to comment on this article.   In my circle I predictably know a lot of folks working in software and computers.  When asked by one of them, my response is as follows:

Think about all the amazing people you have worked with in your career in software.  The people you respected, the people you admired.  You gained this appreciation by watching them work, seeing how they interacted.   Now ask yourself who is likely more akin to these wonderful people you have worked with and admired:  any given engineer or software professional at Amazon OR the two authors of the NYT piece?  Given that answer, who do you believe is telling an accurate and fair portrayal of working at Amazon?

And to put this in highlight, those NYT journos write:

The internal phone directory instructs colleagues on how to send secret feedback to one another’s bosses.

Secret feedback?  It’s a simple peer feedback tool…. as a manager I have valued and made great use of peer feedback for my directs, almost always to build a case for their advancement.

They do not even understand that as engineers we value the opinions of our peers, of those we work with, of those we help via our clever and clean software skills over those of a single manager or some central authority.  Remember, in the NYT authors’ world they value *awards* handed out by select committees… a few elevated individuals judging what is good and what is bad.   They cannot even fathom what software engineers and other computer professionals do on a daily basis, and how we work collaboratively (and agilely) to deliver value to make millions of lives better.

NYT authors succeed by creating a message of their own liking and convincing others of it.  Software professionals succeed by delivering technology that delights customers.

The colors of Microsoft–revisited again

10 August, 2015 (11:36) | Uncategorized | By: seth

In this September 2012 blog post I posited on what the colors of the (then new) Microsoft logo represented

The Four Colors of the New Microsoft Company Logo

Microsoft Logo

I was just riffing… I had no inside knowledge, and was leveraging what others before me had suggested.  Here in summary is what I said:

image

Today for the first time ever I have seen validation of this theory.  Behold:

MSFT_FLAG

Let’s take a closer look at that

image

Well, there you go…. :-)

Amazon and Testing in Productions: Some good, some bad

7 August, 2015 (08:52) | Uncategorized | By: seth

Amazon has a well deserved reputation of being data-driven in its decision making.  TiP is a vital part of this, but may not have always been approached as a legitimate methodology instead of an ad hoc approach.  An example of the latter can be seen by anyone on the production Amazon.com site who searches for {test ASIN}. where ASIN” is the Amazon Standard Identification Number assigned to all items for sale on the Amazon site.  Such a search will turn up the following Amazon items for sale”:

This is TiP done poorly as it diminishes the perceived quality of the website, and exposes customers to risk — a $99,999 charge (or even $200 one) for a bogus item would not be a customer satisfying experience.

Another TiP slip” occurred prior to the launch of Amazon Unbox (now Amazon Instant Video).  Amazon attempted to use Exposure Control to limit access to the yet un-launched site, however and enterprising hacker” found the information anyway and made it public.

However Amazon’s TiP successes should outweigh these missteps.   Greg Linden talks about the A/B experiment he ran to show that making recommendations based on the contents of your shopping cart was a good thing (where good thing equals more sales for Amazon).  A key take-away was that prior to the experiment an SVP thought this was a bad idea, but as Greg says:

I heard the SVP was angry when he discovered I was pushing out a test. But, even for top executives, it was hard to block a test. Measurement is good. The only good argument against testing would be that the negative impact might be so severe that Amazon couldn’t afford it, a difficult claim to make. The test rolled out.

The results were clear. Not only did it win, but the feature won by such a wide margin that not having it live was costing Amazon a noticeable chunk of change. With new urgency, shopping cart recommendations launched.

Another success involved the move of Amazon’s ordering pipeline (where purchase transactions are handled) to a new platform (along with the rest of the site).  A simple” migration, the developers did not expect much trouble, however testers’ wisdom prevailed and a series of online experiments used TiP to uncover revenue impacting problems before the launch [Testing with Real Users, slide 56].

The pyramid and the dog-bone revisited

22 July, 2015 (12:54) | Uncategorized | By: seth

I previously talked about the dog-bone approach to testing, and how we testers love our shapes such as the Test Pyramid.  But I did not connect the pyramid to the dog-bone.  Now permit me to remedy that

Pyramid

This is the Test Pyramid introduced by Mike Cohn in 2009

image

In brief it says

Unit Testing is foundational because

  • It is earliest in the development cycle
  • It gives specific information on the source of the bug (down to the line number in code)
  • It is easiest to automate

UI tests should be kept to a minimum because they

  • Are brittle, expensive, and time consuming
  • Often redundant with Unit Tests, hitting the same code paths repeatedly through multiple UI tests

And service level testing is necessary to fill the gap that unit testing cannot test, but that we do not want to test through the UI.

Dog-bone

Take the pyramid and turn it on its side, and you have a great start to testing in your development cycle.  But I maintain that if your goal for testing is to understand the quality of your system, then something is missing especially after you go to production.   You must leverage the rich data from real users and real usage in production to understand the quality of your system.

image

The techniques by which we use this production data are called Testing in Production, therefore we get the dog-bone approach to testing

https://setheliot.com/blog/wp-content/uploads/2015/05/image2.png

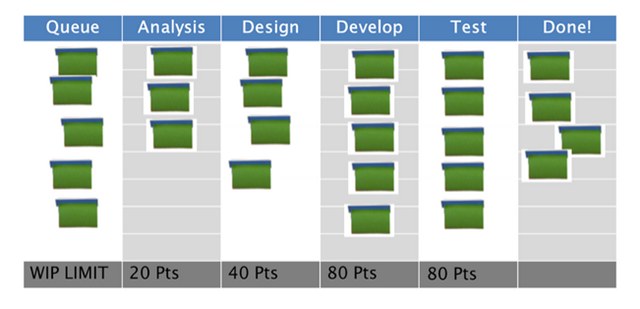
Analysis and Design as named columns in Kanban? In Scrum?

17 July, 2015 (09:14) | Uncategorized | By: seth

I came across this Kanban board

clip_image001

[it is this blog post, but the while the post is interesting, it actually does not at all address what I am about to talk about]

What I found interesting was the Analysis and Design columns. Reflecting on this, this can work for Kanban because it is continuous flow and the Analysis (by the business analysts or Product Owners) does not need to precede the planning stage as it does for Scrum.

So what are the implications here? On one hand it eliminates Spike stories which seems good. On the other hand does Analysis and Design as stages on the board truly deliver value to the customer, or are they just means to an end and therefore should not be reflected in our agile management process?

Leaving Analysis aside because of its aforementioned impact on planning, how about the Design column? How does that help? For standard” scrum design would just be another In Process” task along with coding, testing, etc. Does the separate Design column add anything?